What a Prometheus Counter Really Tells You About a Python API
A Prometheus counter can confirm that a Python API path was hit and later scraped, but it cannot prove the whole application is healthy. This article explains what the observed counter and `up` results mean, how scrape timing and restarts affect interpretation, and what those signals cannot establish.
By Network Nuts · Published 2026-10-17
Three endpoints, three different meanings
The verified Python API behind this article exposes three GET paths, and each one answers a different question.
/health is the simplest. It returns a small JSON document, and in our recorded run, it answered with {"status":"ok"}. That tells us the server accepted an HTTP request for that specific path and produced a response. It does not tell us whether Prometheus scraped anything, whether metrics are current, or whether another endpoint is correct.
/hello is the business-facing path in this tiny example. It returns the greeting payload and increments a Prometheus counter once for each request. The tested source places the increment directly in the /hello branch:
elif self.path == '/hello':
    REQUESTS.inc()
    body, mime = b'{"message":"Hello from the Network Nuts lab"}\n', 'application/json'
That placement is the whole story. The counter is not tracking every inbound request to the process. It is tracking entries into that one branch. So this metric counts /hello requests only. It does not count /health, and it does not count Prometheus scrapes of /metrics.
/metrics serves a different audience entirely. It exposes the metrics payload that Prometheus can scrape. In the lab source, that output comes from the Prometheus Python client helpers, while the web server itself is built with Python's standard-library http.server. Python's documentation explicitly says http.server is not recommended for production, which is useful context here: this is a deliberately small, single-process example for understanding signals, not a model production stack. The Prometheus Python client also documents that a Counter is a value that only goes up during a process lifetime, and that the _total suffix is added on exposition for compatibility with Prometheus/OpenMetrics.
That is why the code defines Counter('lab_api_requests_total', ...) and the observed series name is still lab_api_requests_total: the client library treats this as a counter metric and exposes it in the standard counter form.
What the verified observations actually establish
The verified run gives us four concrete observations, not assumptions:
GET /healthreturned{"status":"ok"}- 20 HTTP GET requests to
/hellosucceeded - the Prometheus instant query
up{job="python-lab"}returned1 - the Prometheus instant query
lab_api_requests_totalreturned20
Those facts support a careful conclusion: in this run, one Python process handled /hello requests, incremented its in-memory counter 20 times, exposed that counter on /metrics, and Prometheus later scraped a sample whose value was 20.
That conclusion is narrower than many people first assume. The value 20 is not a replay of 20 individual events from Prometheus. Prometheus stores samples from scrapes, not an application event log. When you query the raw counter, you are asking for the latest scraped cumulative value, not for a list of the 20 requests.
The rendered verification output below is included as verification evidence for that interpretation, not as a terminal photo.
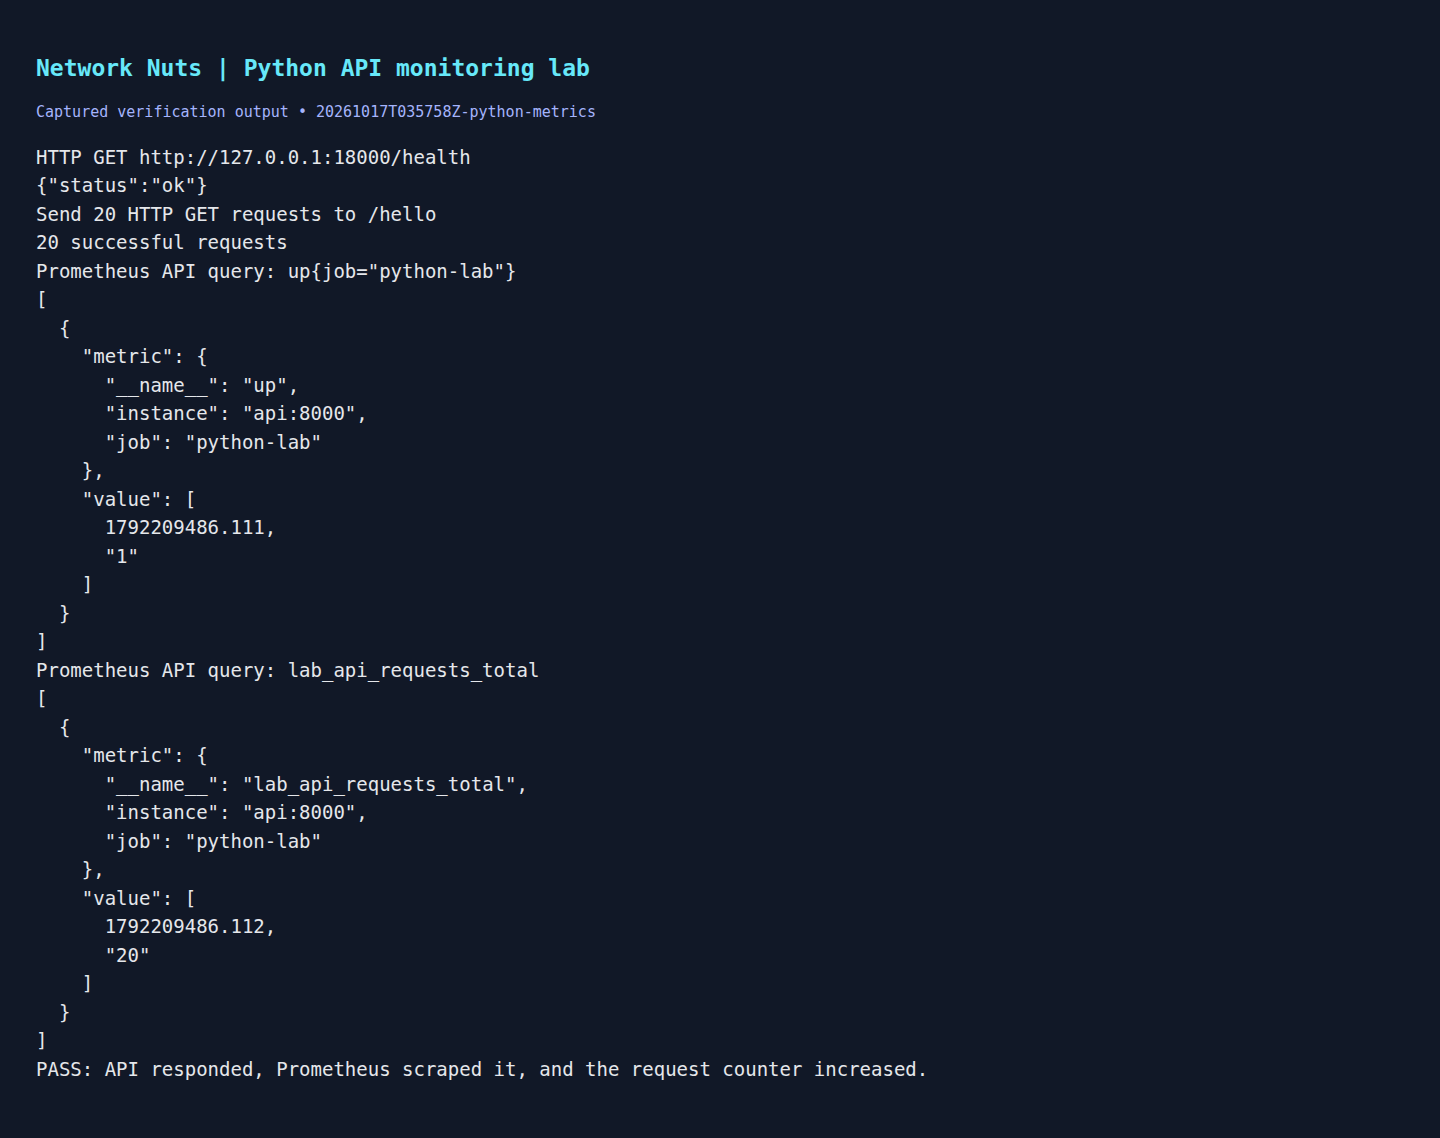
Rendered output from the actual lab verification. Captured 17 October 2026, 09:27 IST. Open full-size image
A counter sample therefore answers a very specific question: how many matching events has this process counted so far? In this case the answer, at the sampled moment, was 20.
Scrape health is Prometheus reachability, not user-facing correctness
Prometheus adds its own built-in health signal through up. The Prometheus Jobs and instances documentation defines up{job="<job-name>", instance="<instance-id>"} as 1 when the instance is healthy in the scrape sense, meaning reachable, and 0 when the scrape failed. The Getting started guide also points operators to the Target health view in the UI to confirm whether configured targets are being scraped.
In the verified run, up{job="python-lab"} returned 1. That means Prometheus successfully reached and scraped the target api:8000 for the python-lab job on its most recent attempt. In this lab, Prometheus was configured to scrape every 5 seconds, so that up value is tied to periodic sampling.
The real Prometheus browser capture below corresponds to that scrape-health view. Read it as “Prometheus could reach and scrape this target,” not as “the application is fully correct.”
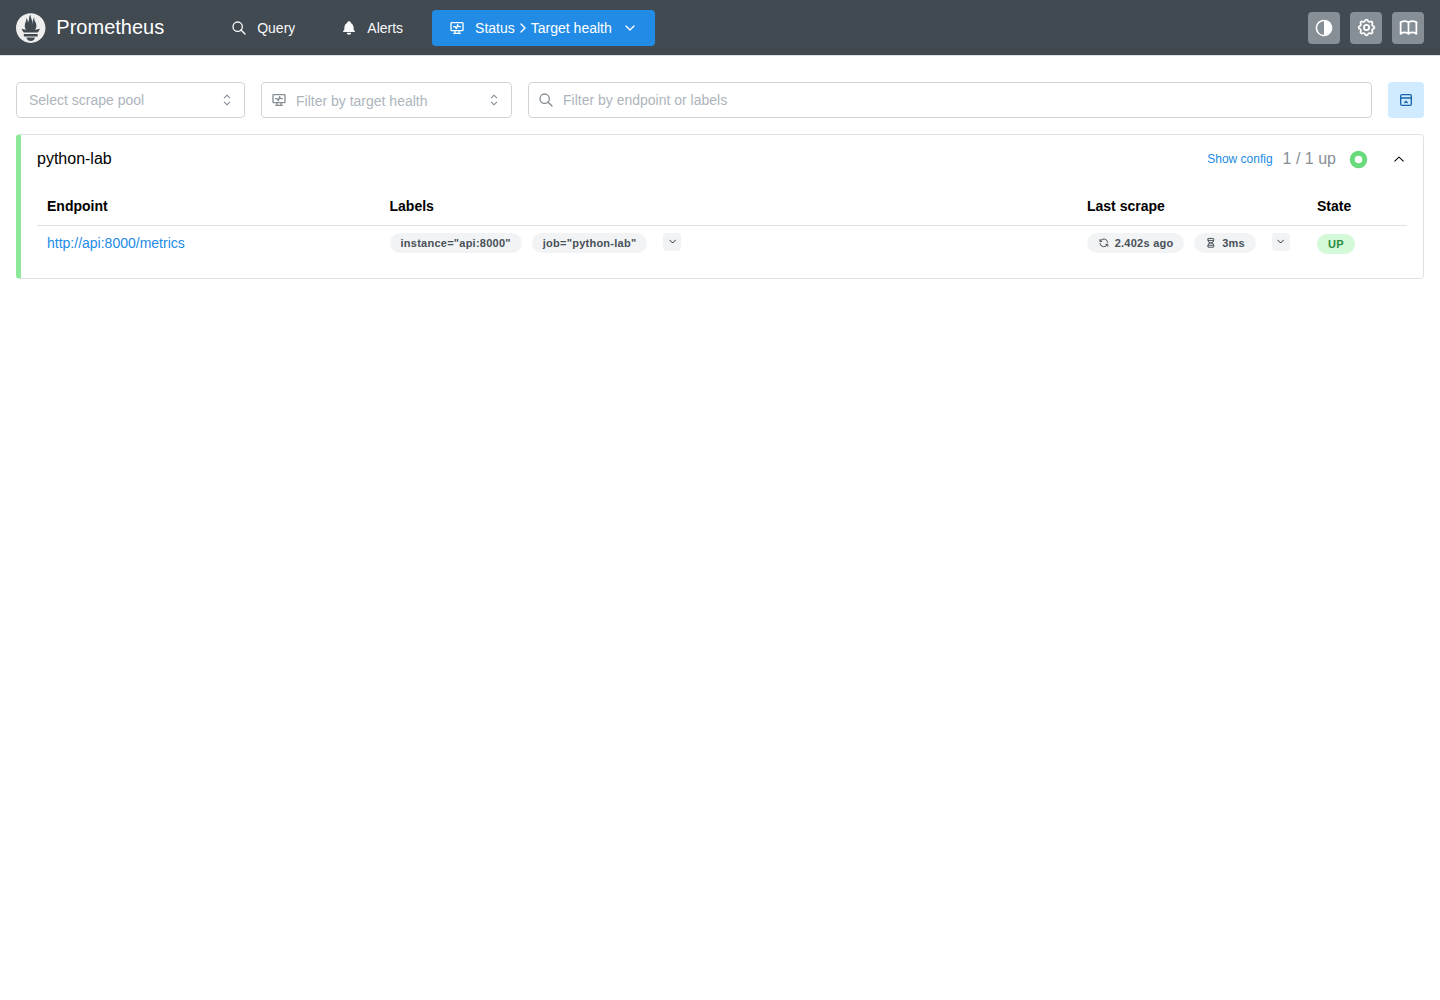
Actual Prometheus browser screenshot. Captured 17 October 2026, 09:27 IST. Open full-size image
That distinction matters because the three endpoints represent different kinds of health:
/healthshows that one application route answered./metricsshows that the process exposed scrapeable metrics.up=1shows that Prometheus successfully scraped the target./helloshows the specific greeting route was hit and, in this implementation, incremented the counter.
None of those alone proves semantic correctness. An API can have up=1 while still returning the wrong data, applying the wrong authorization decision, or serving stale results. Prometheus is telling you about scrape success, not business truth.
A cumulative counter is not the same thing as a request rate
The most common misread of a counter is to treat the raw total as throughput.
In the verified run, this instant query returned 20:
lab_api_requests_total
Because PromQL instant queries return the most recent sample at or before the evaluation time, as described in the querying basics documentation, that 20 means the latest scraped sample for this series had a cumulative value of 20. It does not mean 20 requests per second, 20 requests per minute, or even necessarily 20 requests in the last five minutes.
To ask for a rate, you need a range of samples and a range function. Prometheus documents rate() and increase() separately because they answer different questions:
rate(lab_api_requests_total[5m])
asks for the per-second average rate of increase over the last 5 minutes, while:
increase(lab_api_requests_total[5m])
asks how much the counter increased across that same window. The Prometheus docs also note that increase() is effectively rate() multiplied by the window duration, and that rate() is the normal building block for counters.
So the verified measurement here is still just lab_api_requests_total = 20. The rate(...) and increase(...) expressions are explanatory examples of how you would ask a different question from the same metric family.
Scrape intervals and timing shape what you see
Prometheus observes the world by scraping at intervals. It does not subscribe to every request as it happens. That means timing affects interpretation even when the instrumentation is correct.
This lab used a 5-second scrape interval. If all 20 /hello requests arrive between two scrapes, the Python process can increment the counter immediately, but Prometheus will not report the new value until the next successful scrape. In practice, a graph might show the counter sitting flat and then jumping upward at the next sample.
That is why the raw counter should be read as Prometheus's latest observed total, not necessarily the exact in-memory value at the microsecond you are looking. The querying basics page is helpful here because it distinguishes instant queries from range queries and explains that instant selectors return the most recent available sample for the evaluation timestamp.
The same timing issue affects derived queries. A rate needs more than one relevant sample across a window, and early or very short windows can produce results that are thin or timing-sensitive. That is an inference from how range-vector functions work, not a special quirk of this lab. In other words, the metric can be correct while your chosen query window is still a poor lens.
Process restarts change the counter story again
Counters are cumulative only for the lifetime of the exporting process. The Prometheus Python client says a Counter resets to zero when the process restarts. Prometheus's rate() and resets() functions are designed with that reality in mind: rate() adjusts for breaks in monotonicity, and resets() reports how many counter resets occurred in a range.
That matters a lot in this example because the lab uses one Python process and keeps the count in process memory. If that process restarts, the next raw sample might drop from 20 back to 0 or some smaller post-restart value. The safe first reading is not “requests vanished.” The safer reading is “the process lifecycle changed.”
This is also where the example's limits matter. Because the service is a single-process http.server example, the evidence supports a narrow interpretation: one process counted /hello requests in memory and exposed that total on /metrics. It does not say anything about multi-worker Python servers, shared-state aggregation, or how multiple replicas would combine in a larger deployment.
What these signals cannot prove
Taken together, the verified signals are useful, but they remain partial.
A successful /health response does not prove Prometheus scrape success.
A successful scrape and up=1 do not prove /hello is logically correct.
A counter value of 20 does not prove 20 unique users, 20 completed transactions, or 20 durable writes to a database. It proves 20 counted entries into the instrumented /hello path of this process during its lifetime up to the sampled moment.
Even the full combination observed in our run — /health returning OK, up=1, and lab_api_requests_total=20 — still does not establish latency, resilience, correctness under concurrency, or production readiness. The example is intentionally small so the meaning of each signal is easy to see. The use of http.server and a single in-memory counter should make you more confident about the interpretation of the signals, not overconfident about the system.
That is the practical takeaway: counters are excellent for counting events, Prometheus is excellent at scraping and querying those cumulative series, and up is excellent for answering whether a target was scrapeable. But none of them, alone or together, is a complete proof that an application is correct.
For broader context on building and automating small Python services and tooling, see the Python for DevOps Automation training.
Example source files
The supporting code and configuration on GitHub contain the complete example files discussed in this article.